Attribute based clustering (QGIS Plugin)

GitHub | QGIS Plugins Repository
Clustering
Clustering is a fundamental technique in data analysis used to group similar objects based on their properties. By examining patterns and similarities within datasets, clustering helps uncover meaningful structures that might not be immediately apparent. This unsupervised learning approach is widely applied in various fields, from market segmentation and social network analysis to geographic data processing and scientific research.
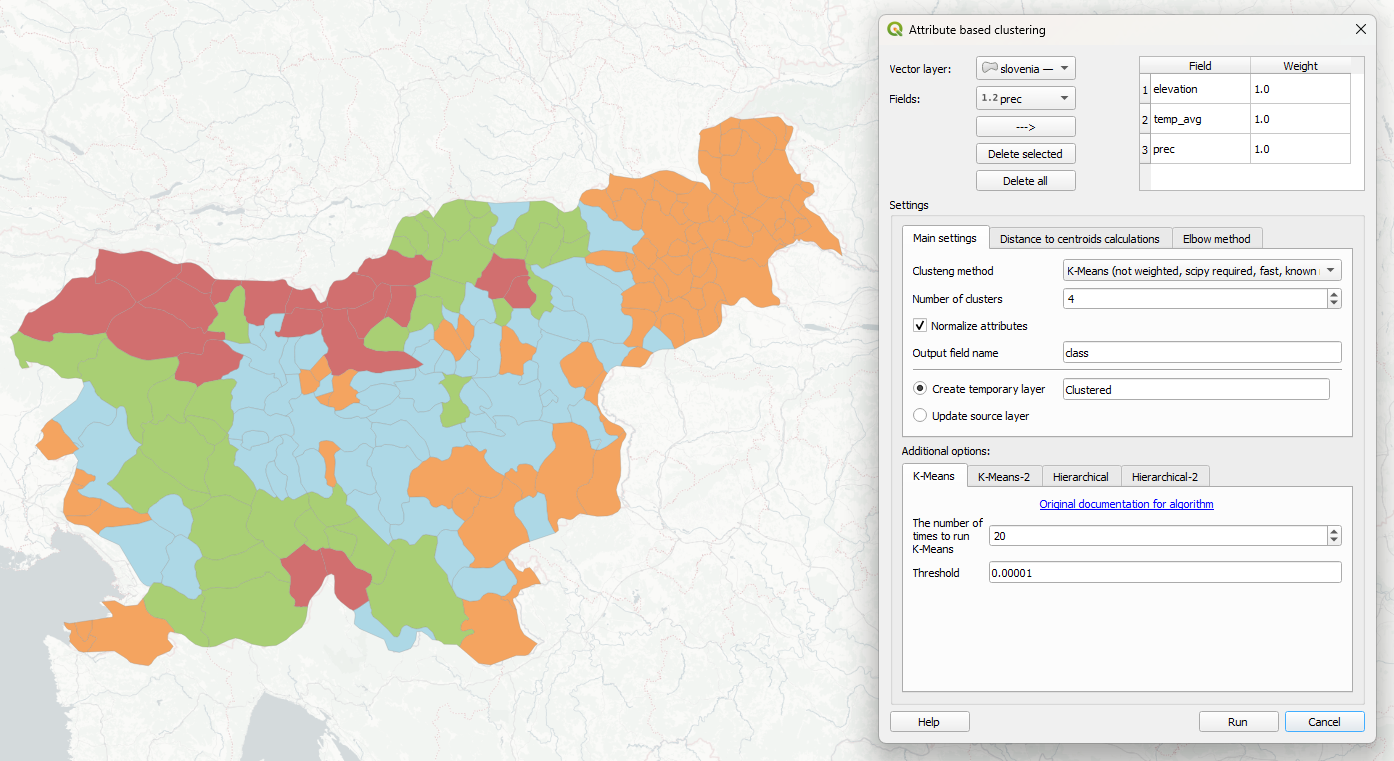
In geospatial contexts, clustering is usually used to reveal patterns in spatial distributions, to group objects by their spatial locations. However, sometimes you may need to group objects based not only at their locations, but also taking into account their semantics, attribute values. Let's take a look at simple example. We have a dataset with administrative boundaries of Slovenia. For each district we have several aggregated environmental parameters: average elevation, annual temperature, precipitation, average minimal and maximal temperatures.

The question we may ask is: based on this parameters, how could we group these districts to 4 categories, based on the principle of grouping together objects with similar behaviour? This is where clustering could help. It mathematically determine the relationships between objects based on all their given properties and then find clusters of objects close to each other.

There a lot of different mathematical approaches to find clusters in data. To illustrate central ideas, let's shortly describe principles of two popular algorithms.
Hierarchical clustering
Imagine we have 6 objects and we want to group them to 2 classes. Each object is described by 2 numeric properties (in real case it could be anything - elevation, price, solar radiation, population, etc, and number of properties could be any). So we can draw each object as point at plot, where axes are it's properties.

On this plot we can calculate distance between all points and find the shortest one - between objects 4 (2;1) and 6 (3;2). We unite them to the aggregated feature with average values. After this step we have 5 features instead of 6, one of which is united version of two sources.

Repeat this procedure - find new two closest feature between these 5, and unite them, and again, and again, until number of features is equal desired number of clusters (2 in this examples).

What we got here: two clusters, two objects (4,6) in first one with centroid 2.5;1.5, and four objects (1,2,3,5) in second one with centroid 8;5.125. This method is quite resource extensive, but very natural and produces understandable and predictable results.
K-Means clustering
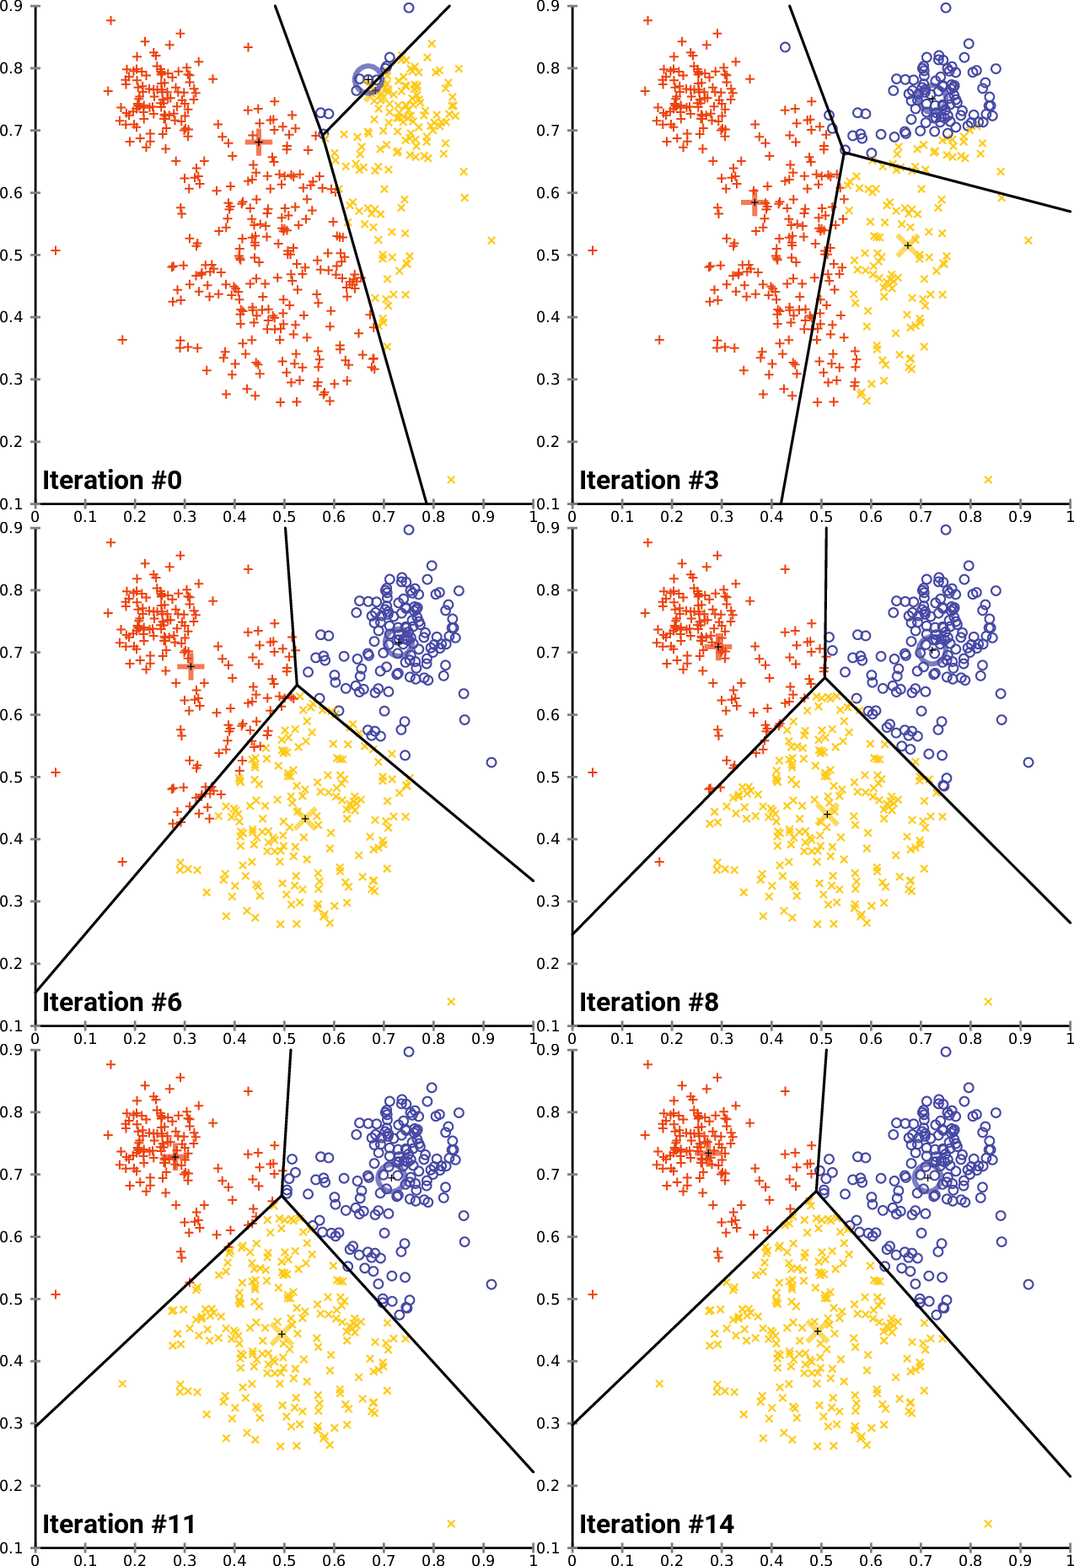
K-Means is another classic clustering method, it's workflow is the following:
- Select random or quasi-random cluster centroids
- Calculate distance from each object to each centroid and find nearest one for each feature. Label it with this centroids number
- Recalculate centroids by averaging real properties values of all features labeled with this centroid
- Repeat 2 and 3 many times
Nice animation from wikimedia:

It's much faster than Hierarchical because there is no need to calculate distances between all features, just between features and centroids. It really matters if you have thousands or millions of objects.
Attribute based clustering plugin
To provide simple, but powerful interface to cluster features based on their attributes in QGIS, I developed Attribute Based Clustering plugin. It's forever free.
Download sample data to try plugin:
Plugin installation
There are two ways to install plugin:
- Simply find it in QGIS Plugins repository
- Download ZIP from here and install it through plugin manager

After installation you'll have Attribute based clustering plugin Vector menu, button on plugins toolbox panel, and group of tools in Processing Toolbox.


Main interface
Setting up clustering
First step is to select layer you want to cluster and it's attributes to use. Layer should be selected in "Vector layer" input, it could be layer of any source and geometry type. Numeric attributes of selected layer are available in "Fields" input, select all needed field in sequence and add them to workspace with "—>" button.

For each added field you could specify it's weight. It will be used by Hierarchical clustering in calculations of distances between features as a coefficient.
Second step is to configure clustering main settings:
- Select clustering method from 4 available options:
- K-Means (not weighted, scipy required, fast, known number of clusters)
- K-Means-2 (not weighted, scipy required, fast, known number of clusters)
- Hierarchical (weighted, native, slow, known number of clusters)
- Hierarchical-2 (not weighted, scipy required, fast, auto number of clusters)
- Set number of clusters (how many groups of features you want to get)
- Activate or deactivate normalization of attribute values. If set, all values would be normalized to 0-1 range (0 for minimal value, 1 for maximal). It is crucial to use normalization, if your attributes contain uncomparable unites (meters, euros, degrees etc.).
- Set output field name. The result of plugin work is a new attribute added to your layer with number of each feature cluster number.
- Set output mode. It could be new temporary vector layer with copy of source layer with new attribute added, or you could modify source layer directly.

In general it's enough for the first run. Additionally you could set custom parameters for each algorithm in additional options block. The meaning of each parameter could be found by link "Original documentation for algorithm".

After pushing "Run" button you'll get new attribute with cluster number for each feature.

Distances to cluster centroids
Sometimes it's important to research clustering results more precisely. Using Attribute Based Clustering plugin you can get distances from each feature to all cluster centroids, to understand position of particular feature in general context. To activate these calculations, go to "Distance to centroids calculations" tab and select on of three modes:
- Do not calculate distances (default) — to skip distance calculations
- Calculate distances to centroid of object's cluster only
- Calculate distances to all centroids
If calculate distances, you should also set prefix for new fields with distances names. For example, if set "dist_", and run clustering with 4 clusters, you'll get four new fields: "dist_0", "dist_1", "dist_2", "dist_3", with distances from each feature to each of 4 clusters centroids.

For example, this feature labeled with cluster number 0 has least distance (0.10) to cluster 0, that's why it was labeled this way. But we could also see, that it's relatively close (0.21) to cluster 1, and far away from clusters 2 and 3

By coloring features using distance to some cluster centroid we can get interesting distribution of "similarity to this particular cluster".

Finding optimal number of clusters: the Elbow method
Another additional feature of Attribute Based Clustering plugin is built-in helper in defining optimal number of clusters. As long as basic algorithms require known number of clusters to work with, it's always a tricky task to come up with some number.
Classic approach to define optimal number of clusters is the Elbow method. The idea is to calculate sum of squared distances from each feature to it's cluster centroid, and compare this sum under different number of clusters to use. The result is a plot like this:

According to the Elbow method, the optimal number of clusters corresponds to the last step with a sharp change of the curve angle, in example it's 3.
Built-in interface is very simple and available at "Elbow method" tab. The only thing you have to set is a maximal number of clusters to use for calculation (how far "Number of clusters" axis should be on the plot). All clustering settings would be taken from current state of "Main settings" and "Additional options".

Processing tools
After installing the plugin it will also appear as group of tools in Processing Toolbox:

From here you can run each of available clustering methods as standalone tool, run it as batch process, use it in Model builder, run from PyQGIS.
All parameters are the same, the only significant difference is the way of setting up weight for hierarchical clustering. Instead of table there is a string input, where you optinally could enter weights for every field as float numbers separated by semicolon:

In shown case weights are the following:
elevation | 1.1
temp_avg  | 1.4
prec      | 0.8
Using Attribute Based Clustering plugin for location based or hybrid clustering
Sometimes people ask if they could use the Plugin to cluster data based in locations, not attributes. Of course you can. The trick here is to transform your location data to attributes, for example keeping point coordinates or centroid coordinates as X,Y fields, and then use them as inputs for clustering.

More than that, it opens you a possibility to perform hybrid clustering, taking into account both location and semantics.
If you found a bug, have questions or suggestions, please contact me, I would be glad to improve the Plugin.